Democrats need to pick up 20 seats to tie up the PA House, and 19 districts currently held by Republicans voted for Clinton in 2016. All of them are in the Philadelphia region. I’ve profiled Delco’s District 168, and Philadelphia’s District 177. Both of those are nested in Congressional Districts that FiveThirtyEight considers “Solid”, and all “Solid Democrat”.
The only Congressional District in the region that is considered “Likely”–the step lower–is Bucks County’s CD 1, where Incumbent Brian Fitzpatrick R is favored to defeat challenger Scott Wallace, with a 78% chance as of the time of writing this.
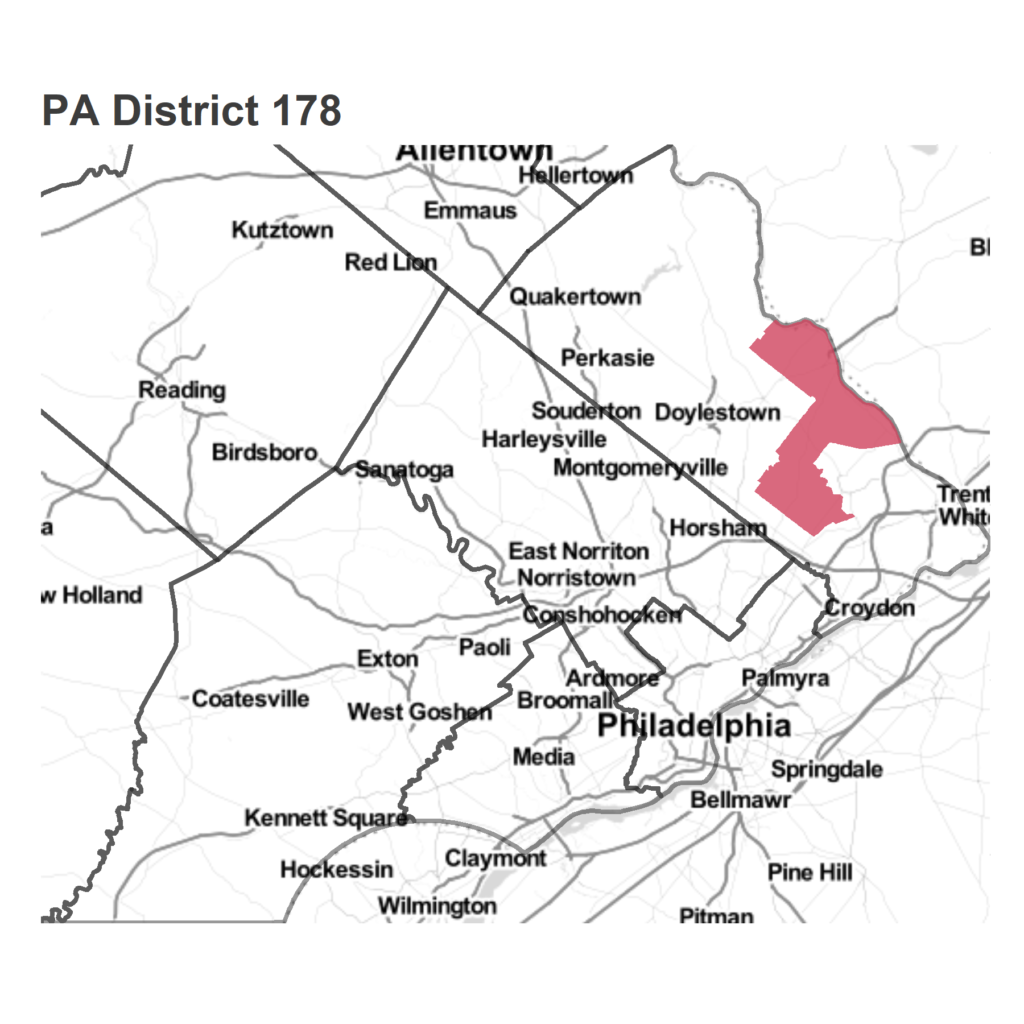
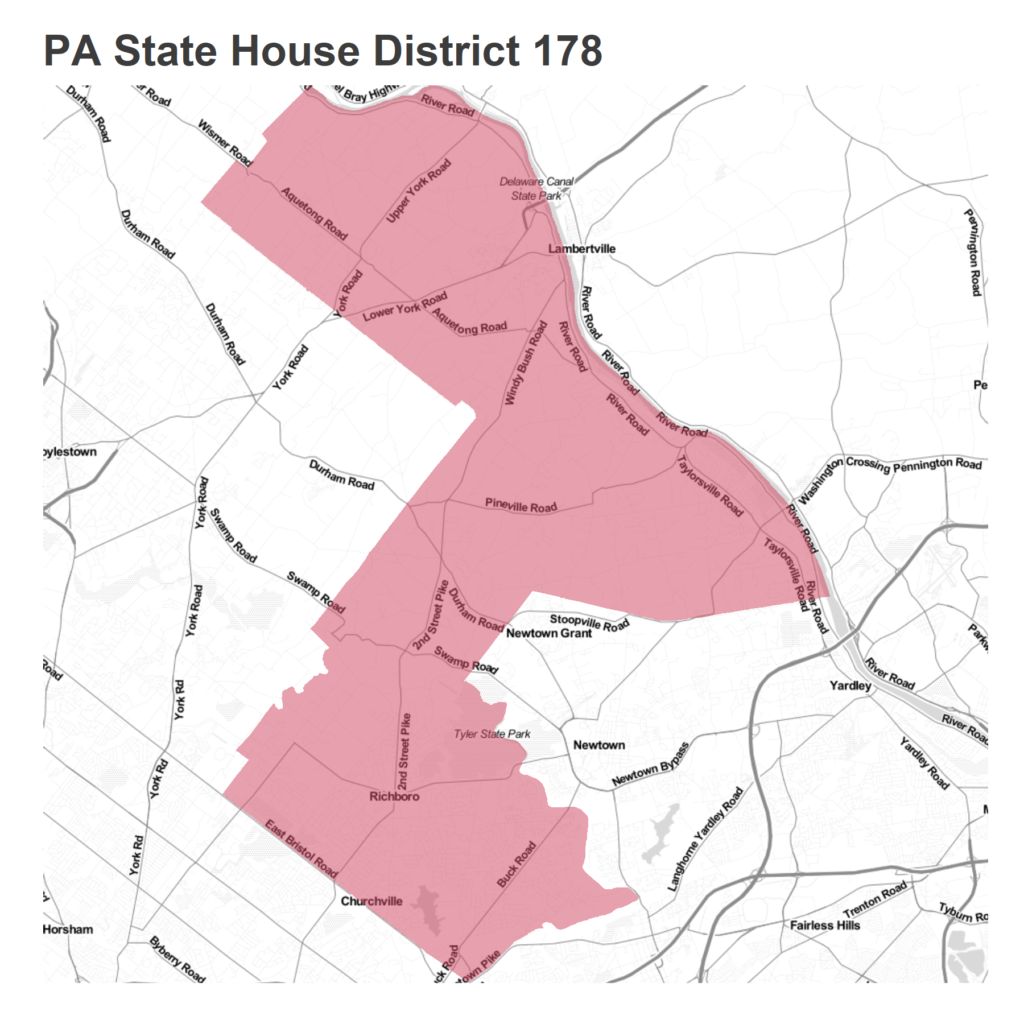
Bucks County has within it some fascinating State House races. Maybe the most interesting is District 178.
District 178
|
|
Until December 2017, the district had represented by Scott Petri (R), who stepped down to become the Executive Director of the PPA. He was replaced in a Special Election in May, in which Democrat Helen Tai beat Wendi Thomas by the narrowest of margins.
How close was the special election? Tai won by 101 votes, 6,366 – 6,265. Less than 1% of the vote. In fact, in the separate primaries that happened the exact same day, Thomas received 6,649 votes, and Tai received 6,269. Tai won by the margin of people who forgot to push both buttons. It was close.
The two are facing off again in November. Could the Special Election result be carried over to a higher-turnout general?
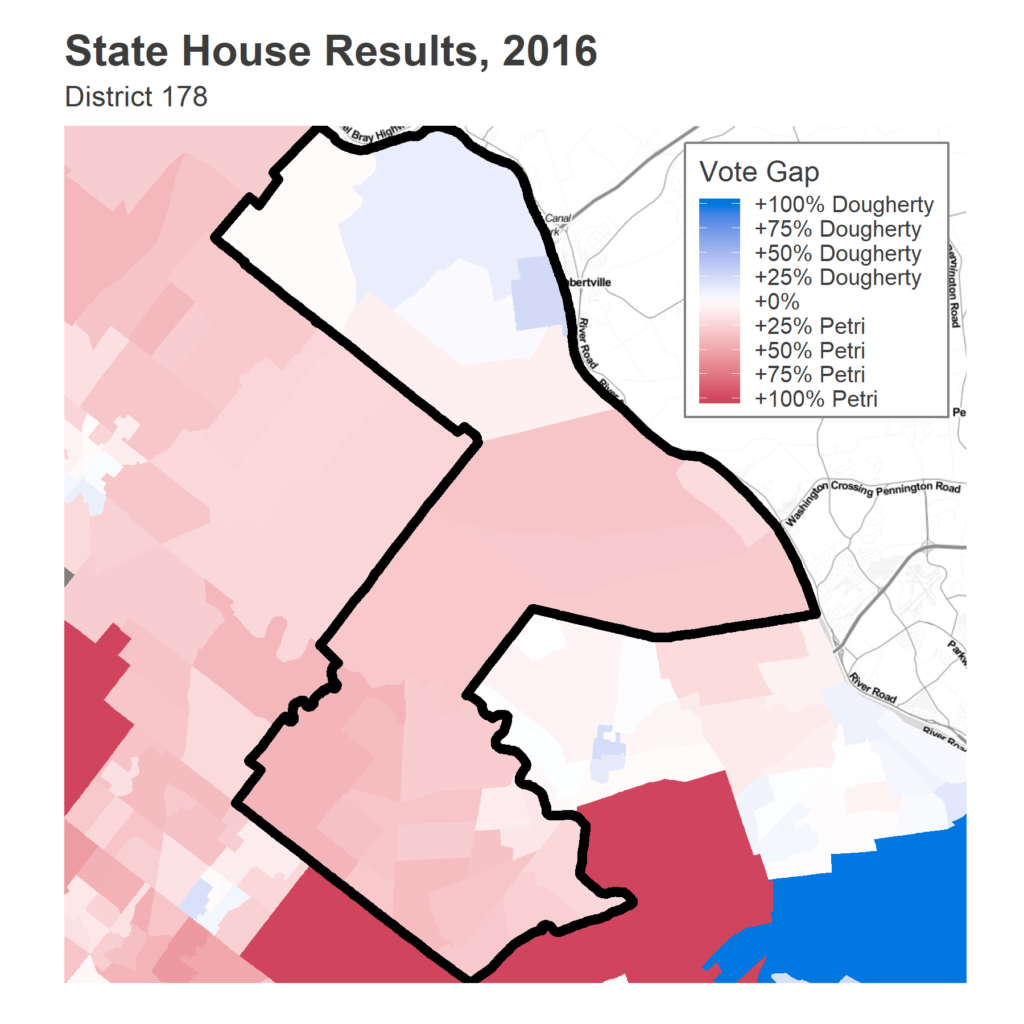
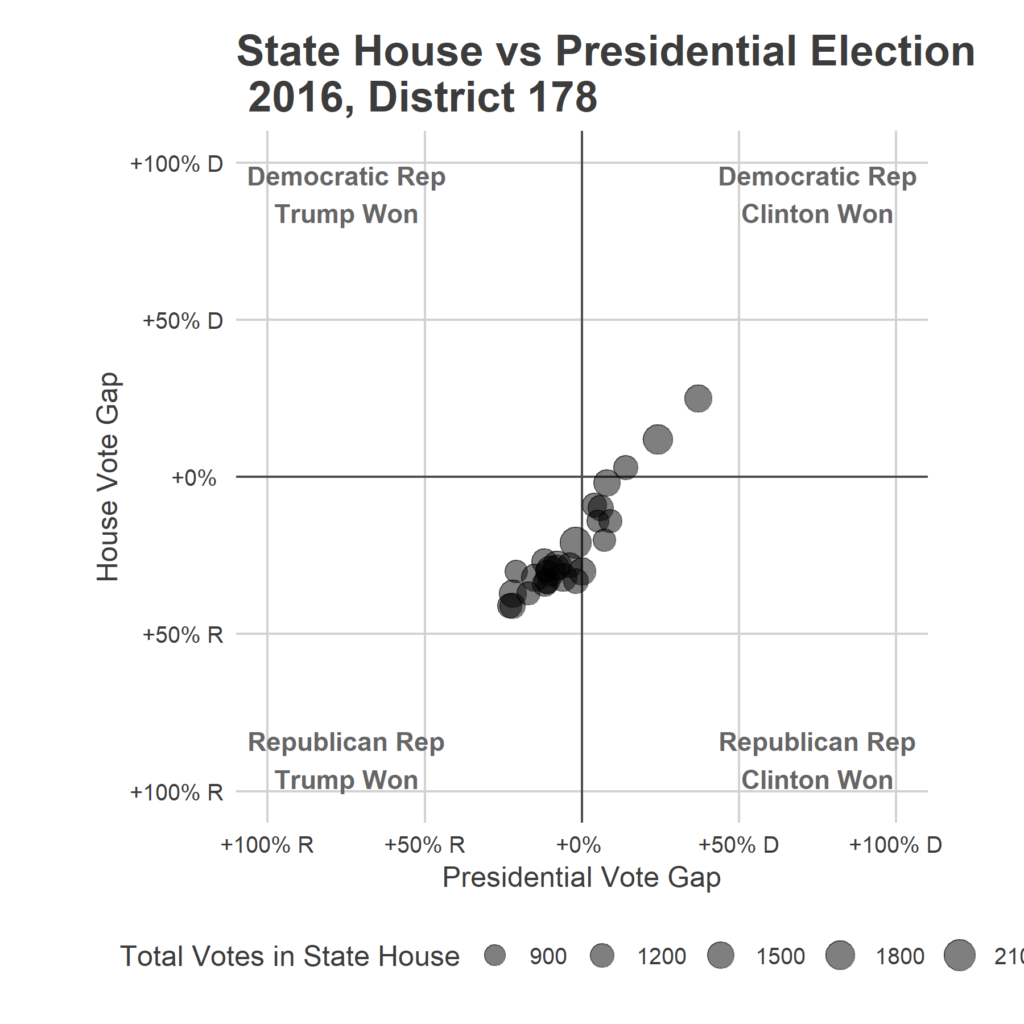
The district swung hard towards the Democrat in the Special Election. In 2016, Petri won 61% of the state house vote, even as Trump won only 51%.
 |
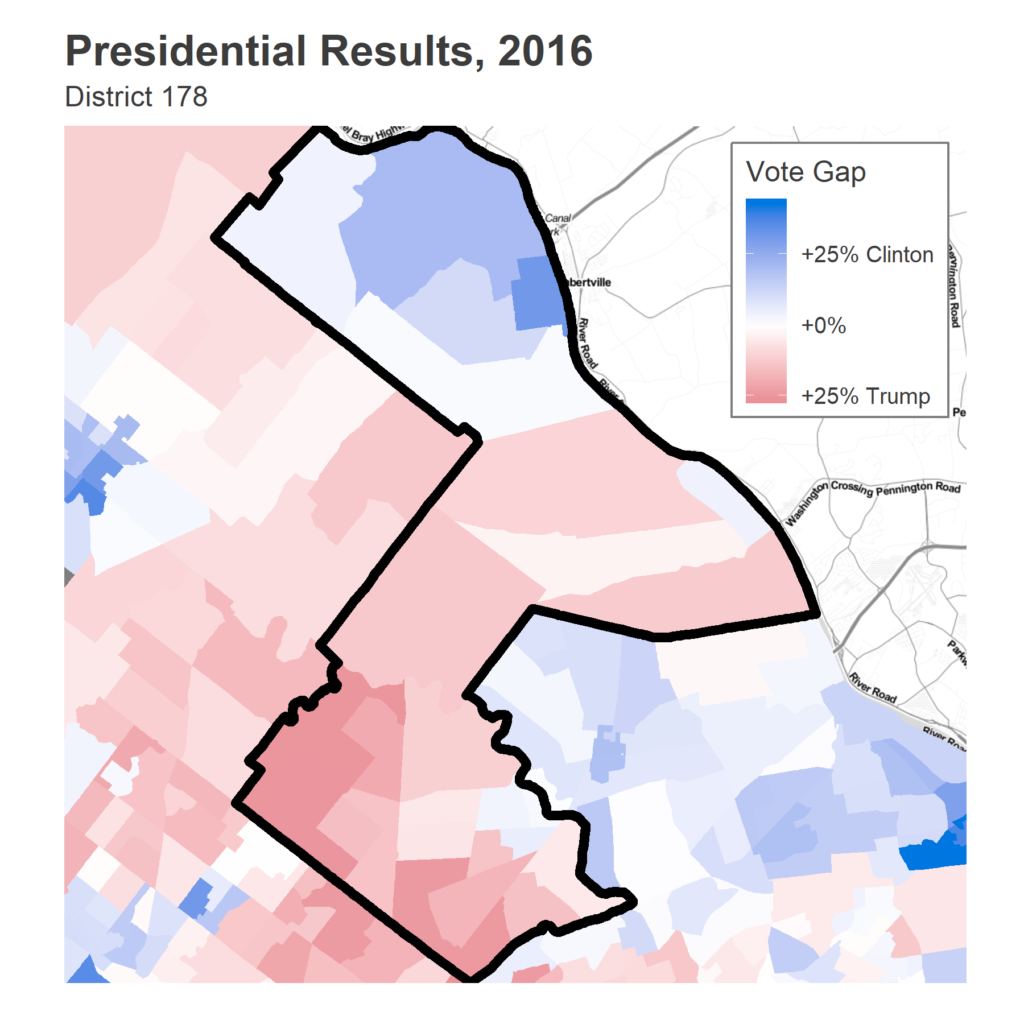 |
New Hope and neighboring Solebury voted overwhelmingly for Clinton, and even marginally for Democratic Rep Dougherty. The entire south of the district voted for Petri and for Trump.
Every single precinct in the District voted more heavily for Petri than for Trump in 2016.
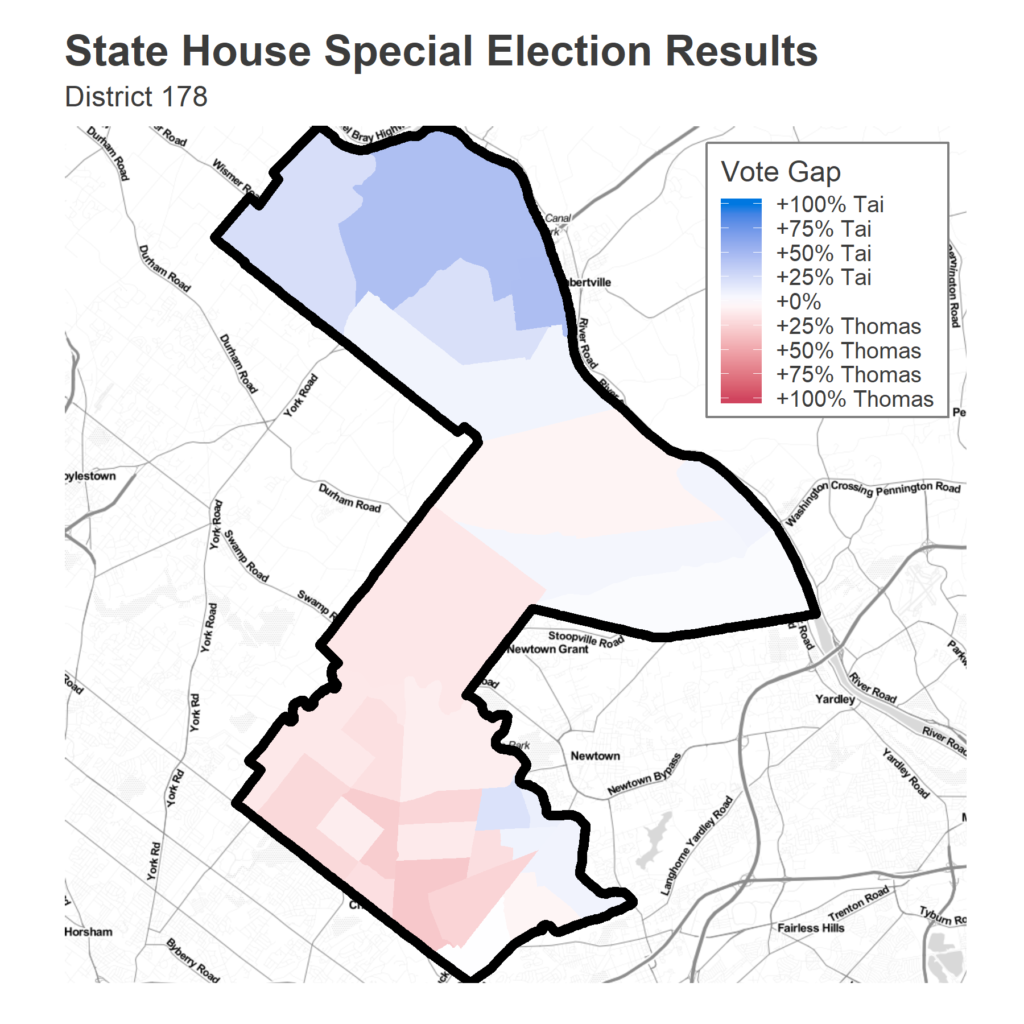
Here’s the corresponding map for the Special Election. Every precinct swung towards the Democrats.
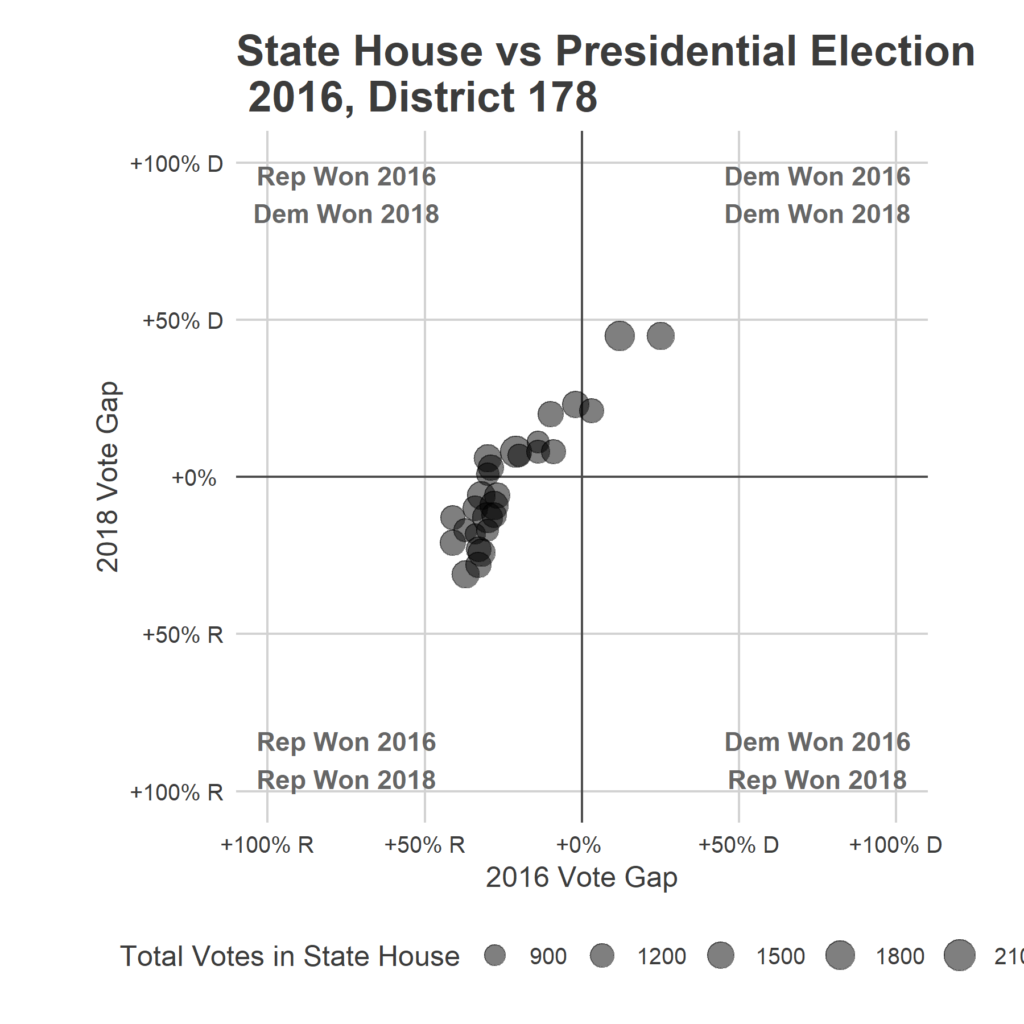
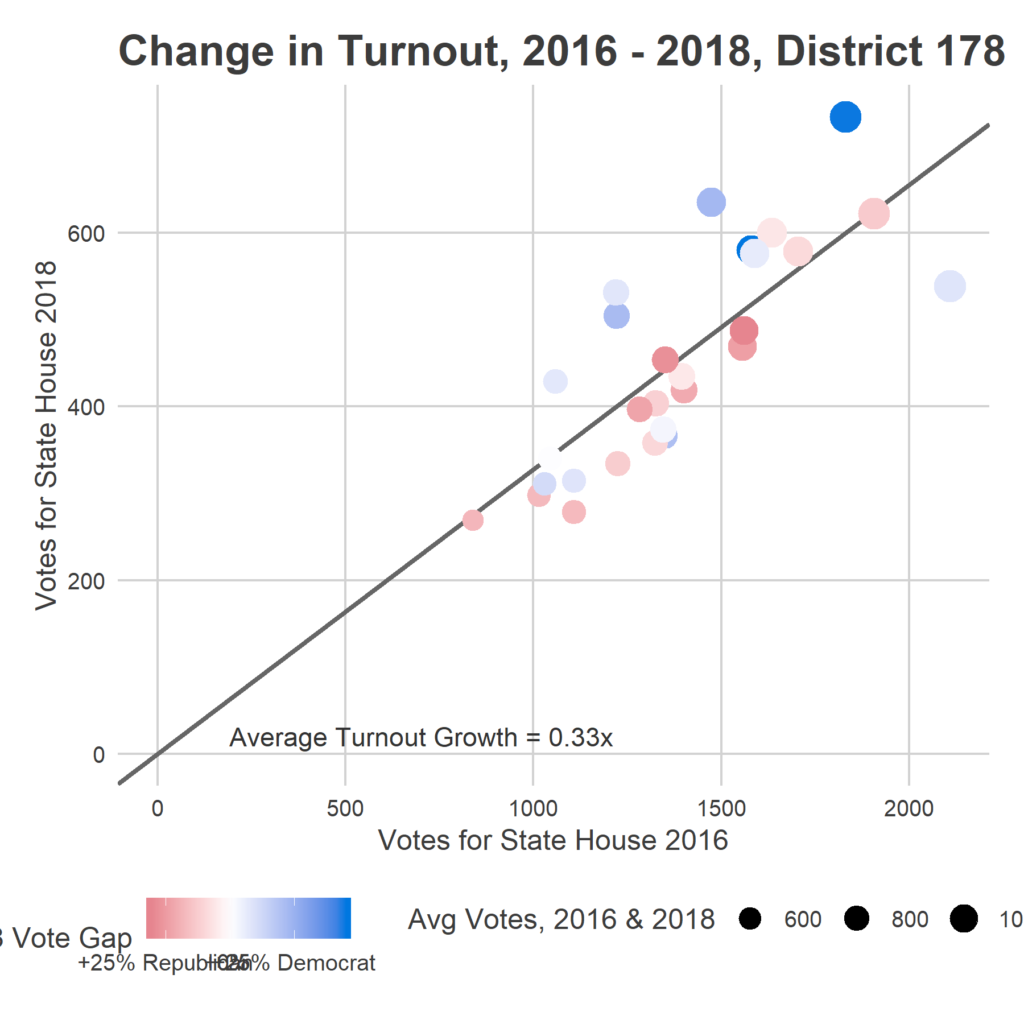
The swing was huge. Below is a similar scatter of precincts, but comparing 2016 to the 2018 Special election. Points above a 45-degree line mean that they voted more Democratic in 2018 than 2016. (Every point is above that imaginary line)
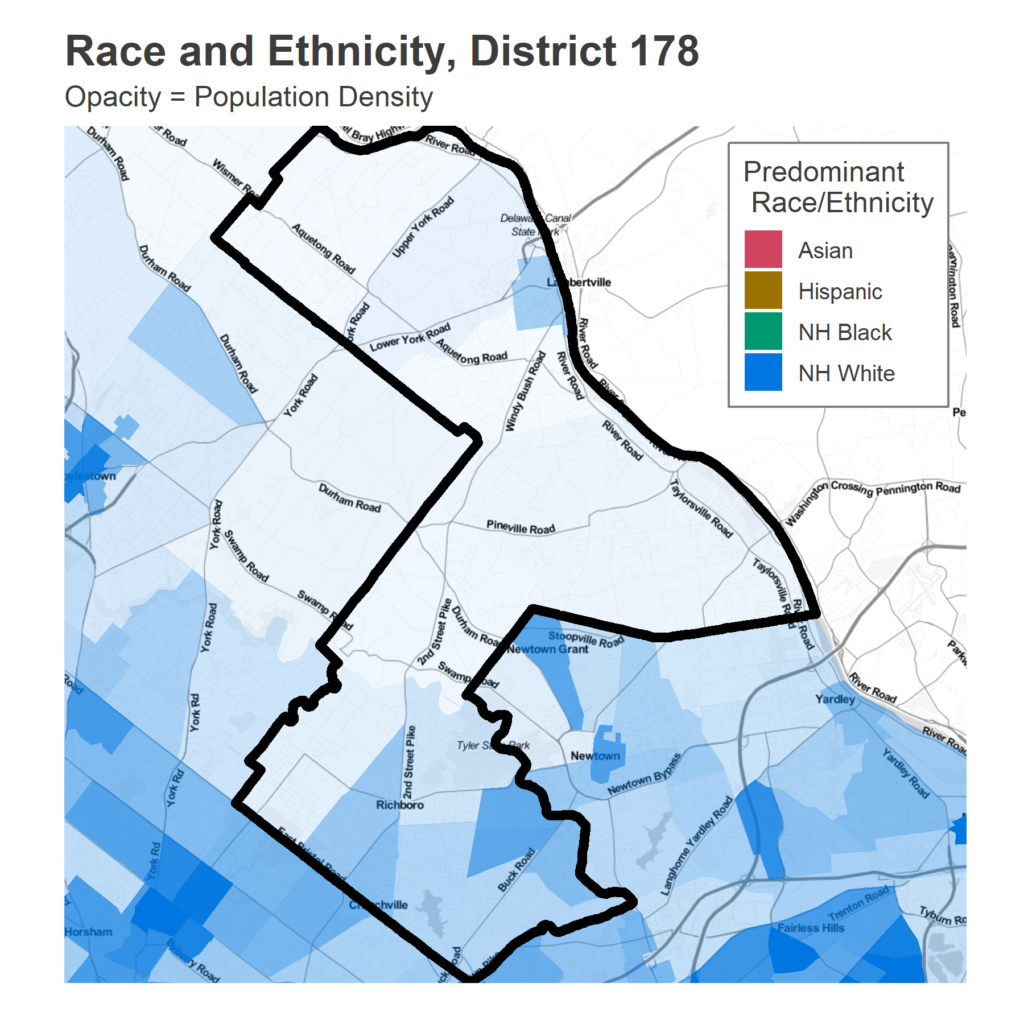
The district is heavily White. Some 89.5% of the residents are non-Hispanic White, with 4.5% of the residents Asian, 2.6% of the residents Hispanic, and 1.5% of the residents Black.
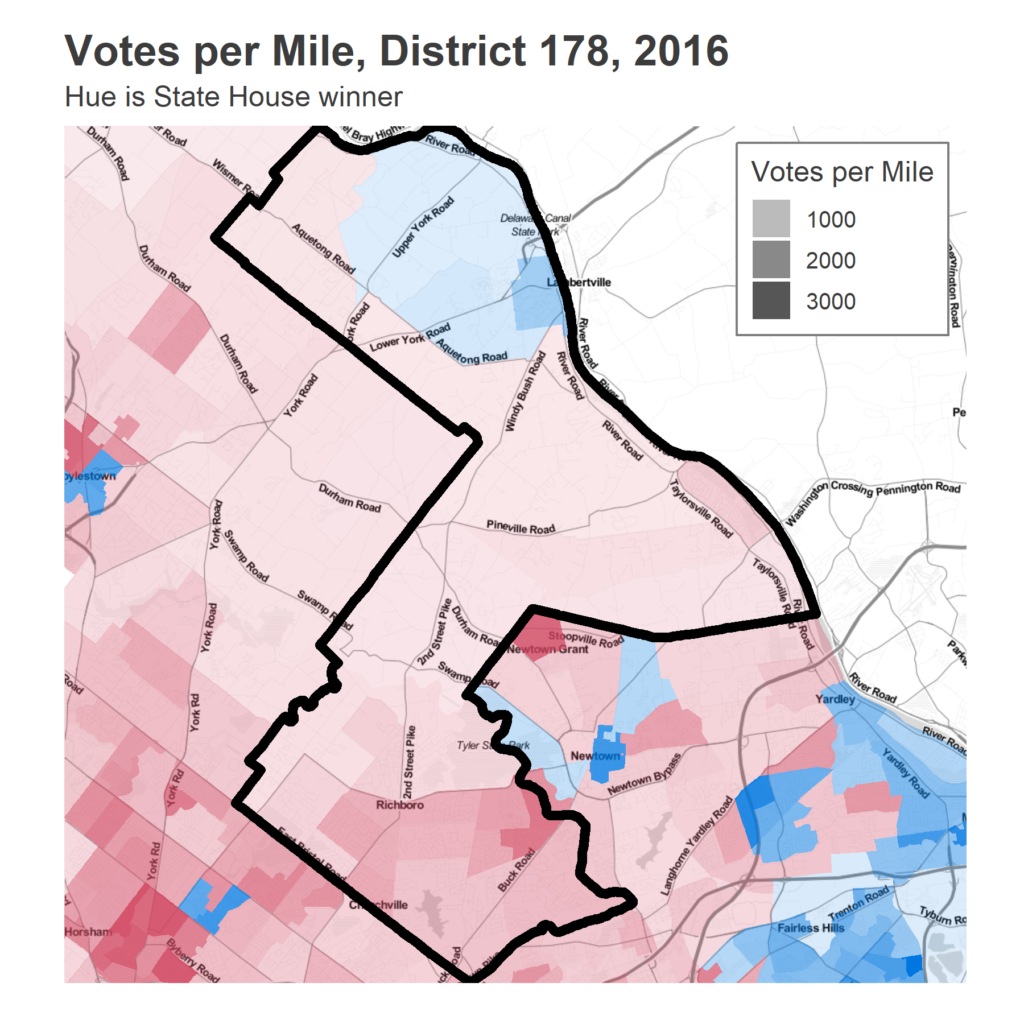
The turnout of the district typically favors the south, where population and votes are denser. Here is the turnout for 2016.
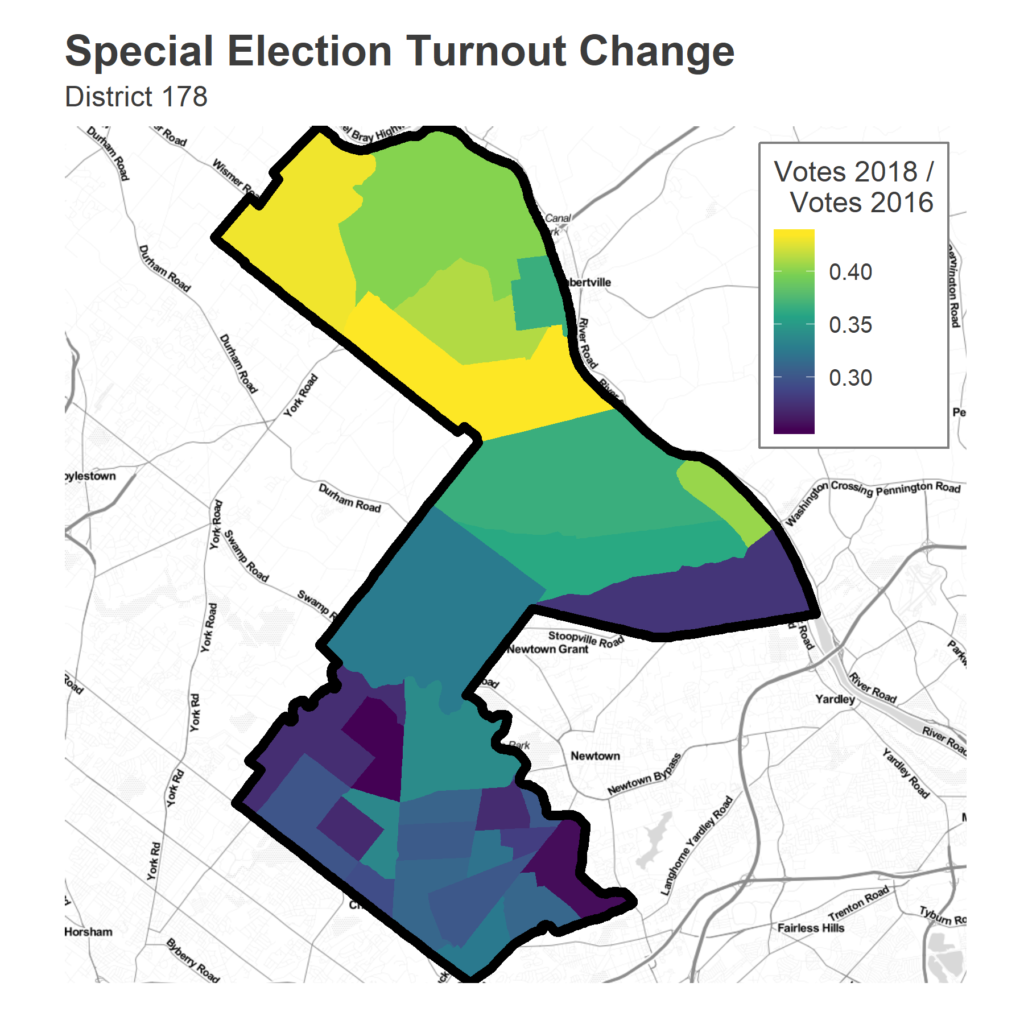
But turnout changed dramatically for the Special Election. Comparing the relative change in turnout from 2016 to the Special Election, the north lights up. In 2016, 38,588 votes were cast. In the Special Election, 12,631 votes were, for an average ratio of 33%. But the north voted at rates up to 40% of 2016, while many of the southern district was below 30%. Overall, the south still can carry the day, but by much less than before.
In 2014, 23,544 votes were cast for Governor, with Corbett beating Wolf with 54% of the vote. Petri ran unopposed for the PA House.
So we should probably expect at least twice as many voters in November as in the Special Election. Will the Republicans from 2014 and 2016 show up as they do in every midterm? Or is the shift more substantial?
This race could serve a sign of a huge Democratic wave in November. If Tai wins reelection, that will mean that a District that voted for Trump in 2016 and had a long-serving Republican representative was caught up in a Democratic. It would have been impossible to imagine a Democrat winning this district four years ago, but Helen Tai did it in May.
Sources:
Election data from the Open Elections Project
Population data from the 2016 American Community Survey 5-year estimates.
Boundaries and GIS data from election-geodata
Base maps provided by maps.stamen.com/