This week, I’m profiling each of the State Supreme Court’s new Congressional Districts, looking at their voting behavior and their demographics. Today, the new District 02.
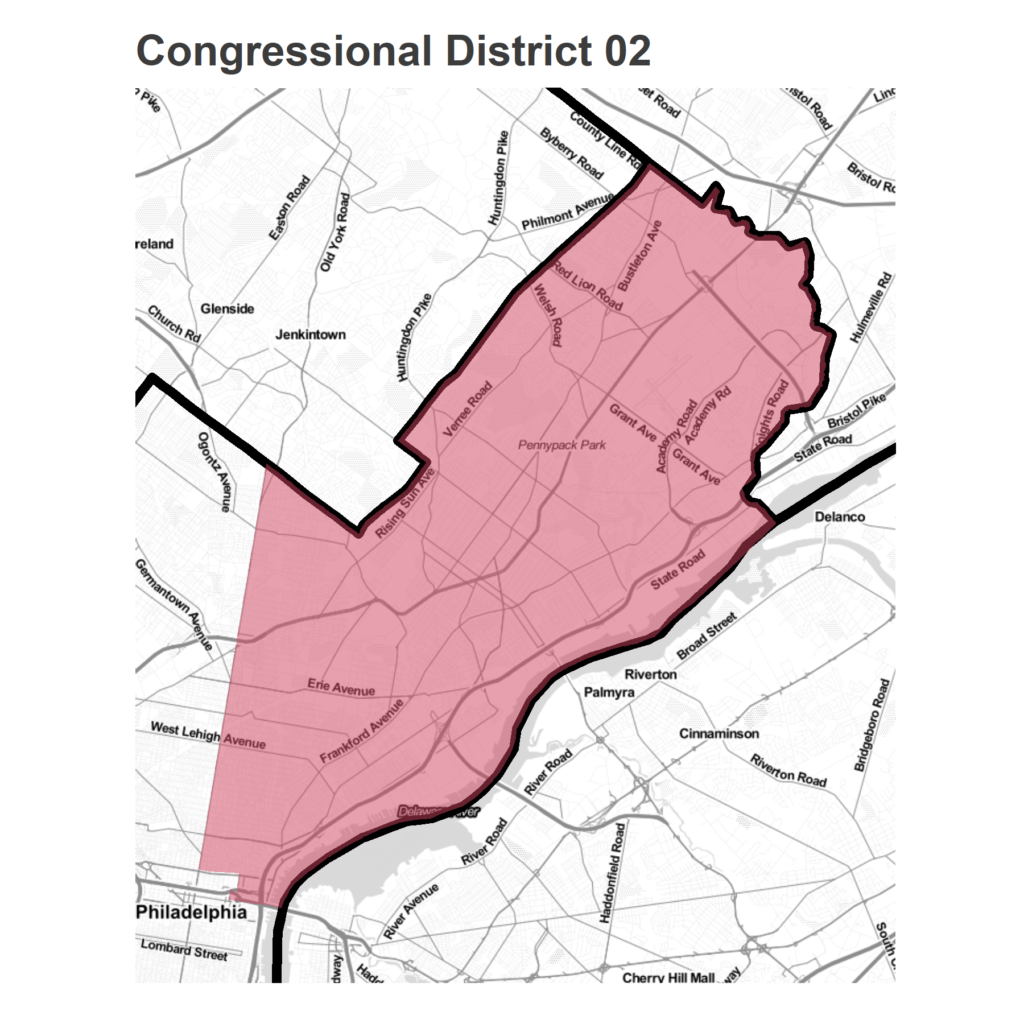
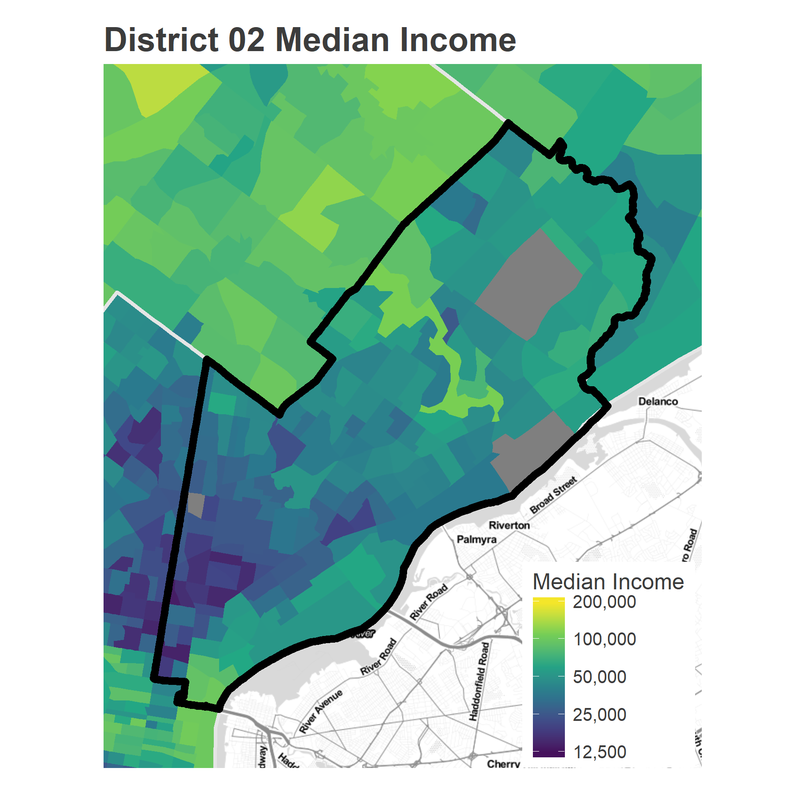
The new District 02 covers Northeast and North Philly; basically the entire city above Race/Spring Garden and East of Broad. This is a diverse swath of the City, combining some of the poorest sections of North Philly with gentrifying Fishtown, with the Trumpy “Middle Neighborhoods” in the Northeast.
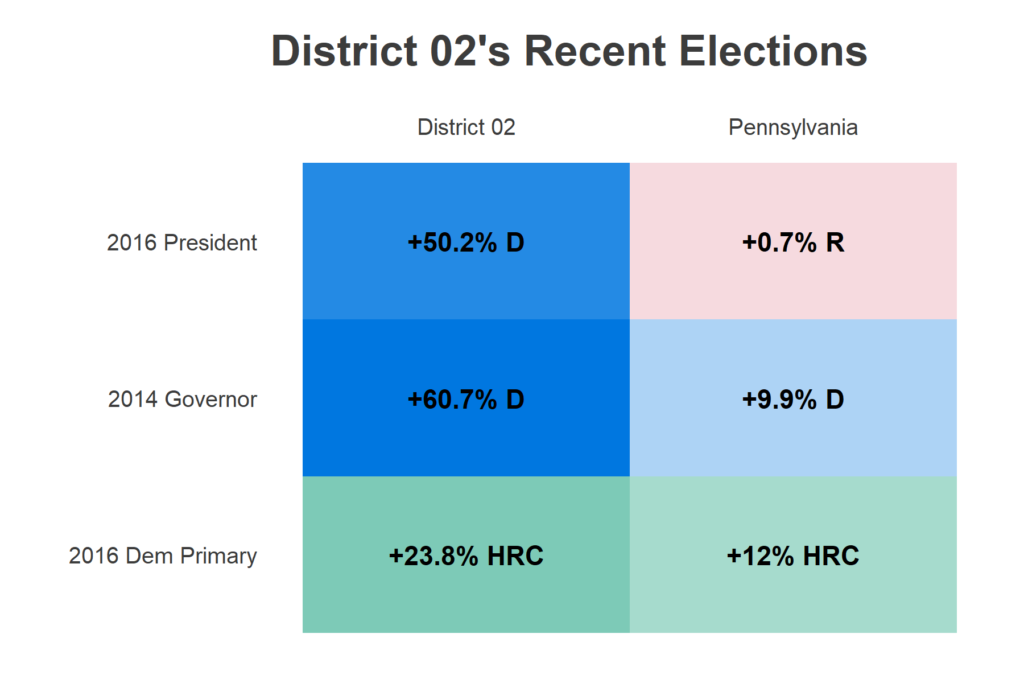
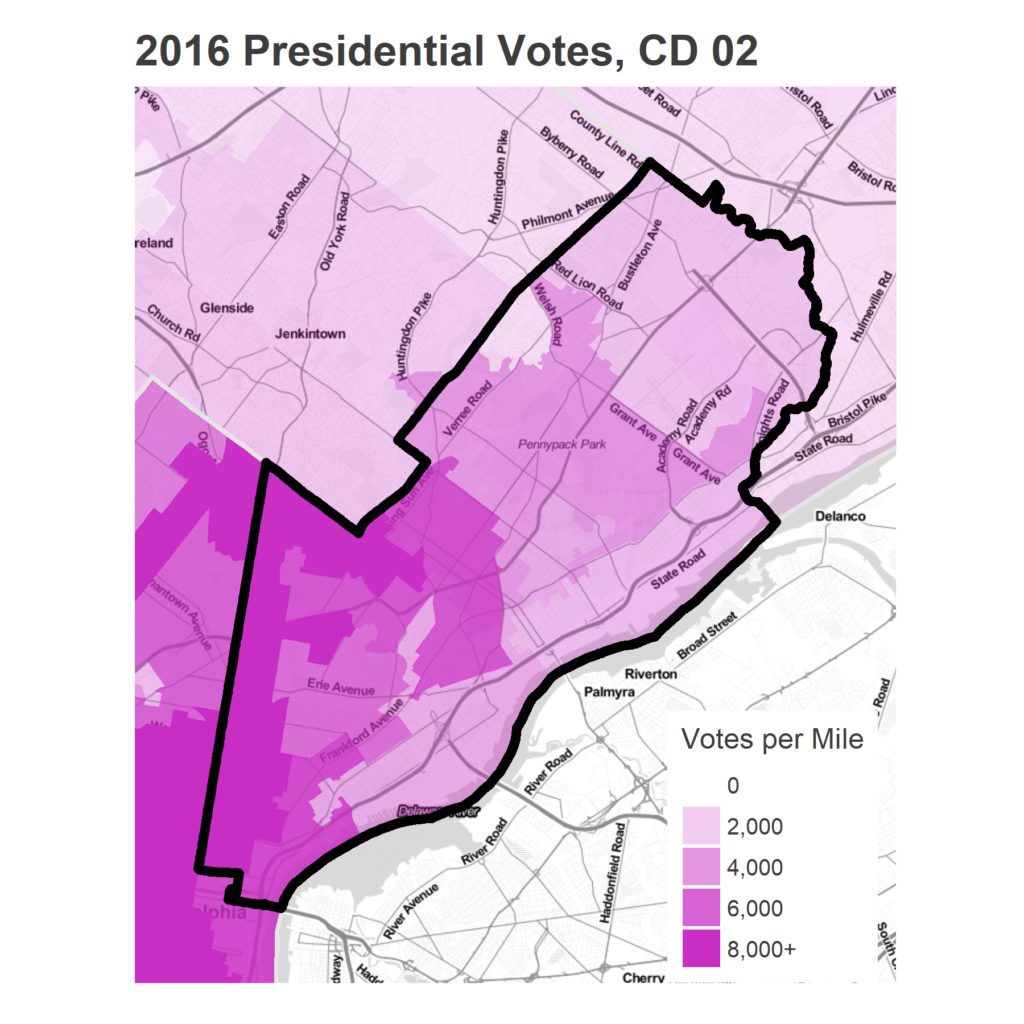
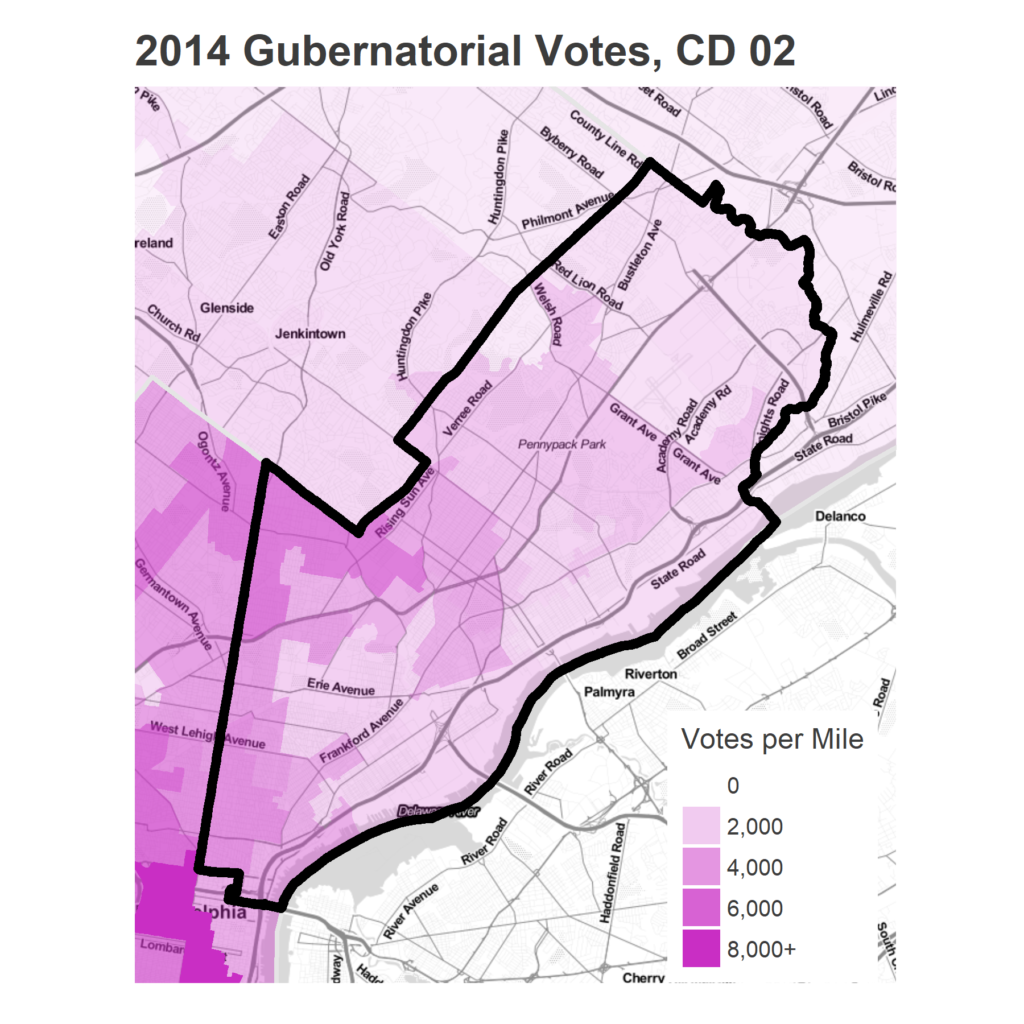
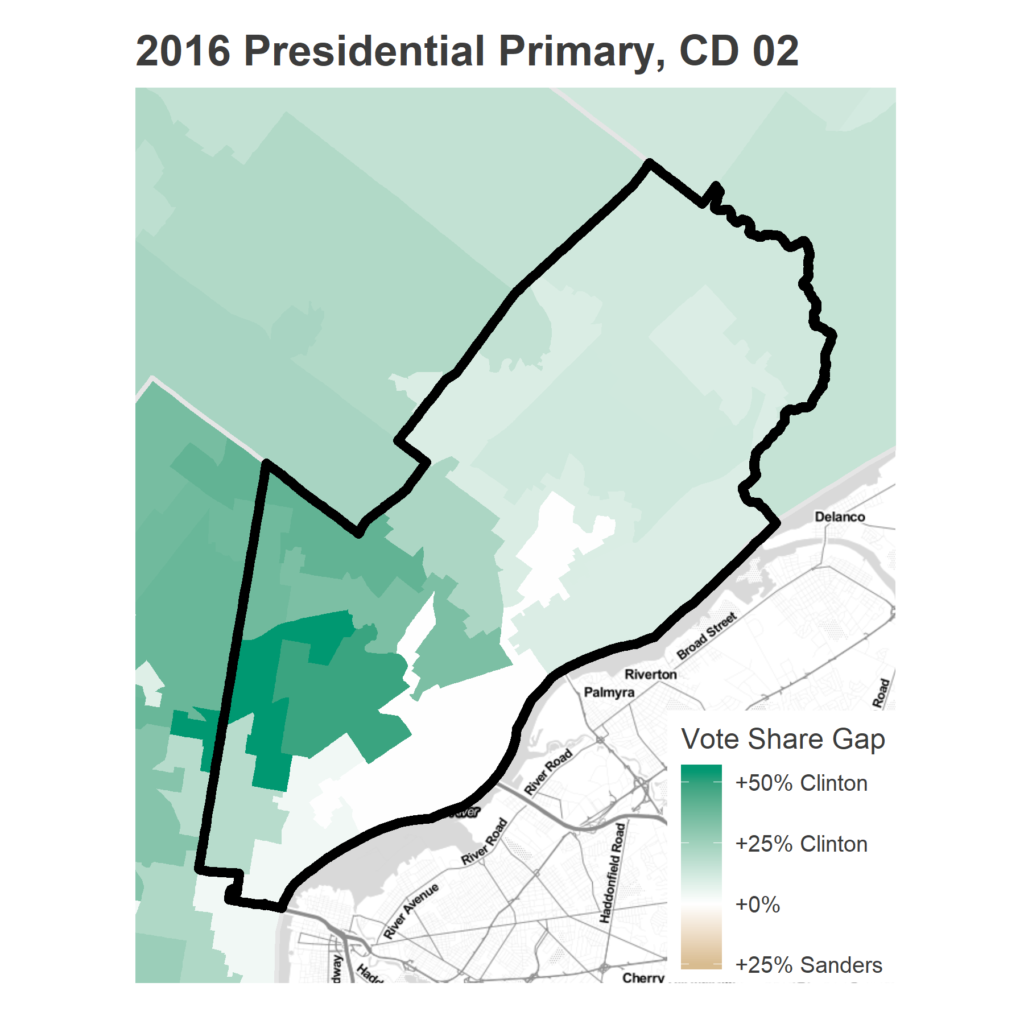
Overall, the district is decisively Democratic. It voted 75-25 for Clinton in 2016, and 80-20 for Wolf in 2014. It also voted for Clinton over Sanders in the 2016 primary, 62-38, by more than the state as a whole.
That decisive Democratic 2016 victory was the function of a Democratic sweep of North Philly, combined with basically a even split between Clinton and Trump in the Northeast.
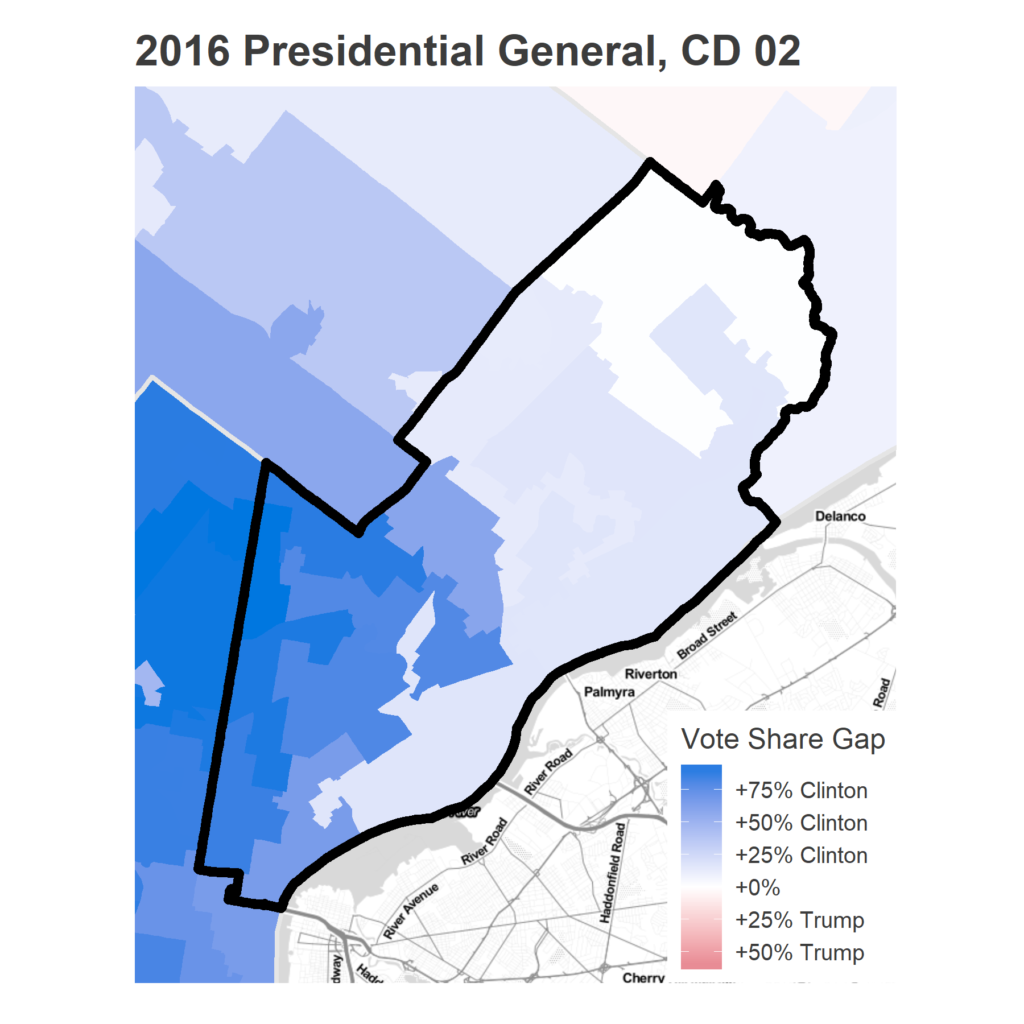
The Democratic map almost perfectly lines up with the racial Demographics. Those Trumpy neighborhoods were also the White neighborhoods (with the only exception of Northern Liberties at the bottom), while the Black and Hispanic neighborhoods voted decisively for Clinton.
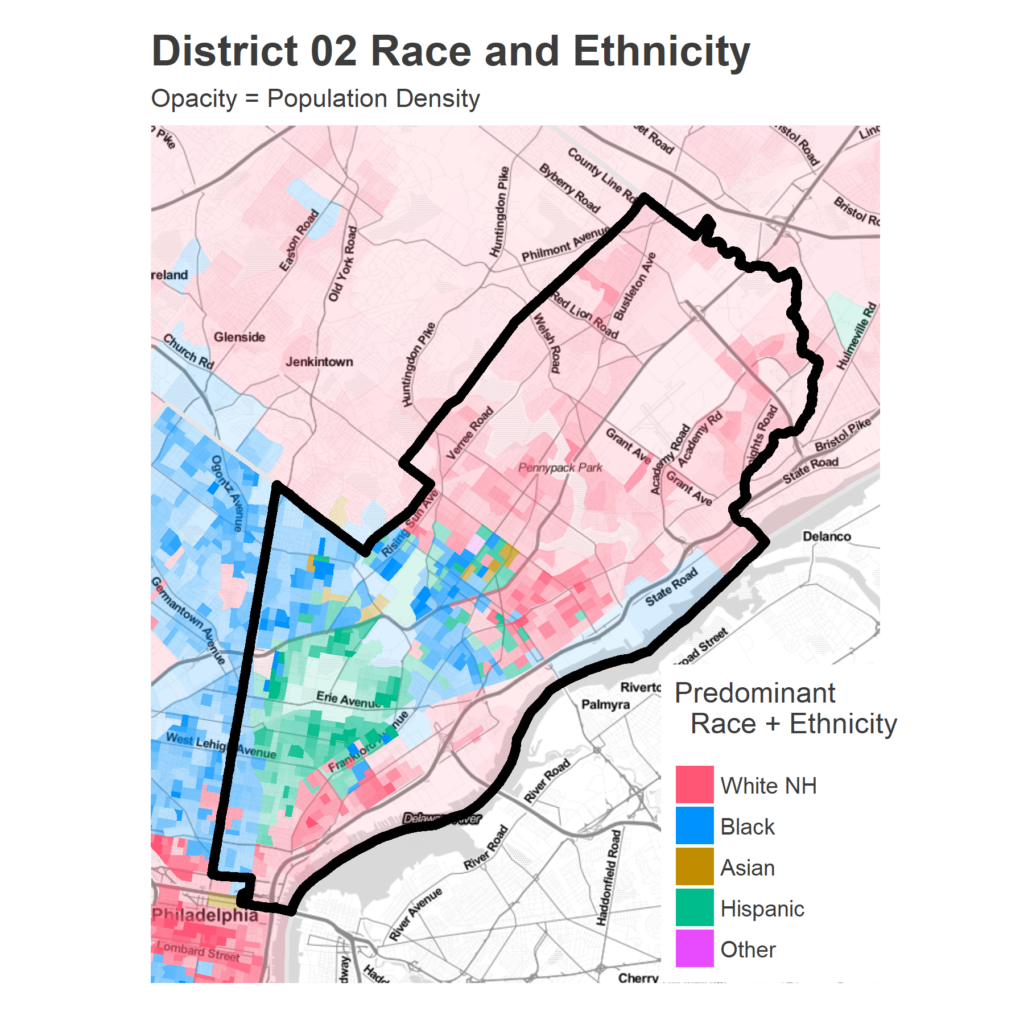
The areal maps can mislead about proportionality; North Philly is *much* denser than the Northeast. Those votes carried the day. Notice that even though the Hispanic section around Erie Ave have the population density, their low voting rates mean that their votes per mile is lower than their neighboring Black neighborhoods.
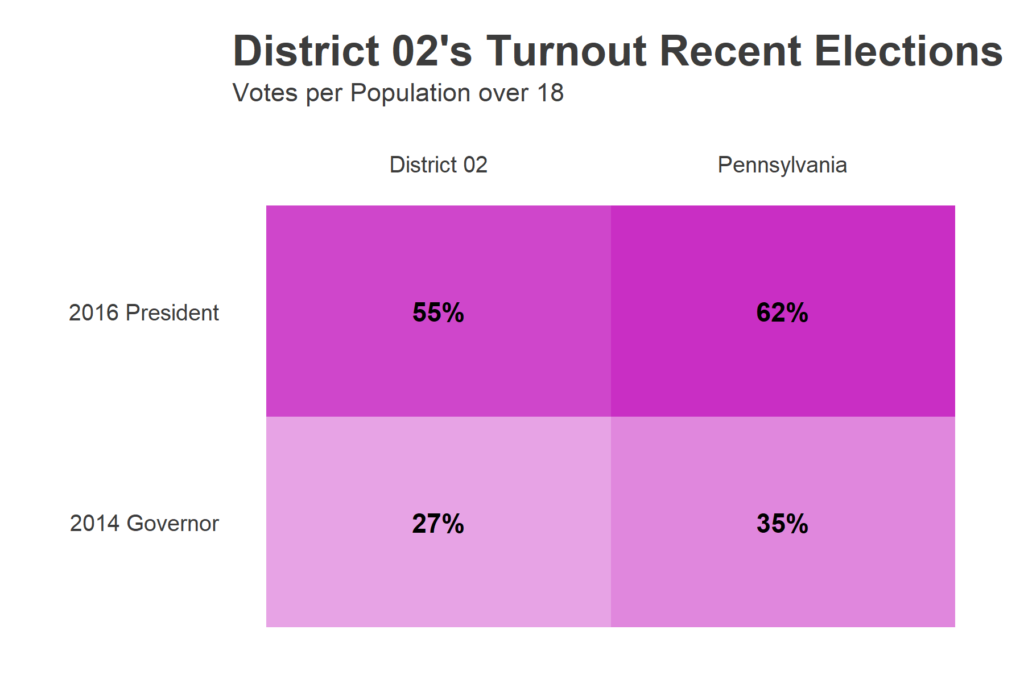
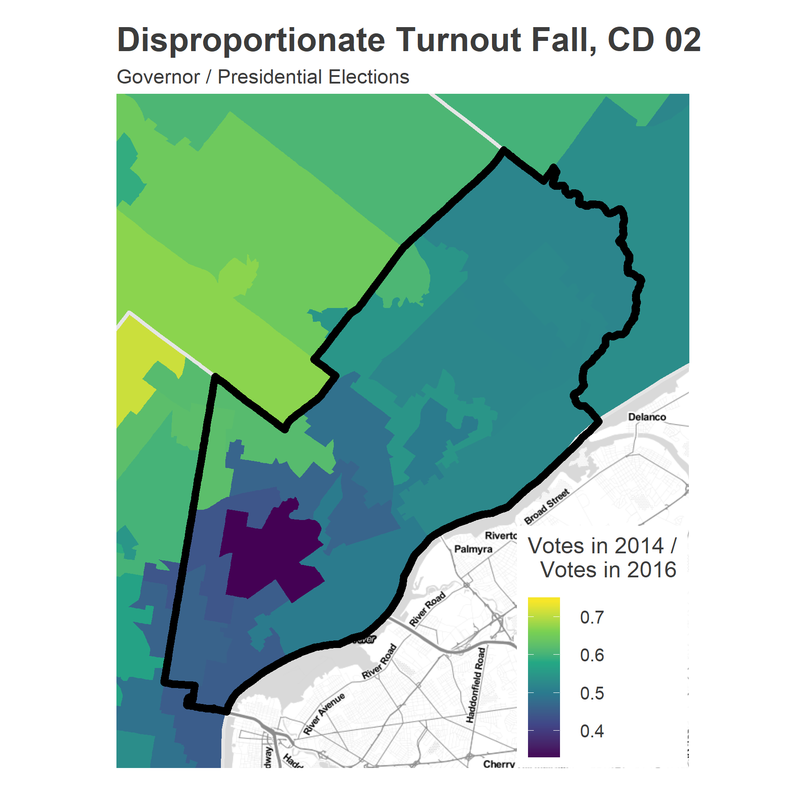
Of course, 2018 is a Gubernatorial election, not a presidential election. Turnout is much lower in these elections, and different people vote. This district sees its votes fall by half, in line with the state overall.
And neighborhoods fall disproportionately too.
Among the Democrats, which neighborhoods are the Berniest? Which are the Hillary-est? While Hillary swept the District, she decisively won in the Black and Hispanic neighborhoods. This matching between Sanders strongholds and Trump strongholds plays out all over the city, and across the country.
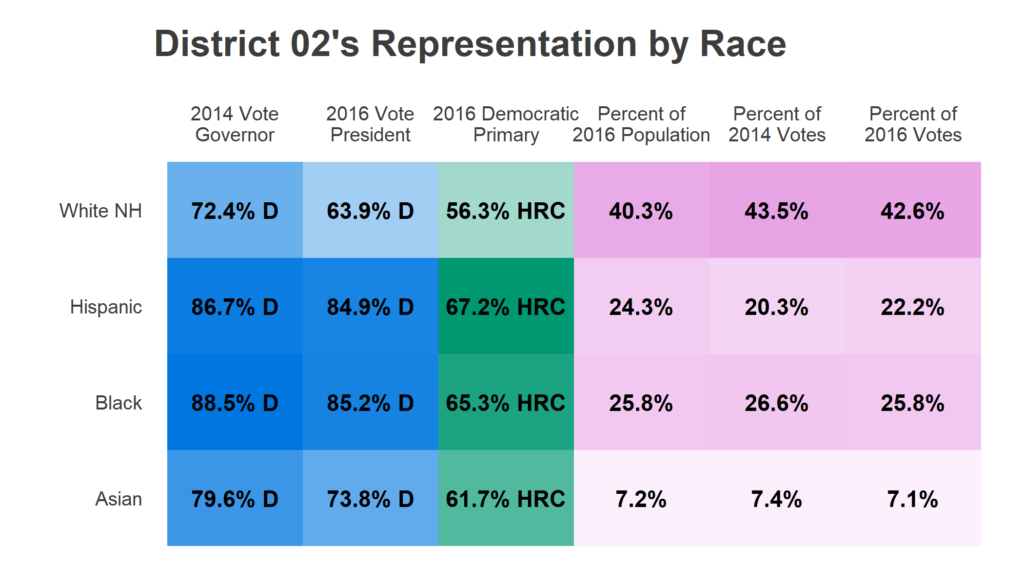
Finally, we can cross-tabulate votes by race. We don’t have voter-level results by race, so I approximate it by aggregating votes to Census Block Groups, and allocating votes within them. This isn’t perfect (see Ecological Fallacy), but block groups are small enough and Philadelphia segregated enough to make this a very good proxy for how different racial groups voted. (Note, these percentages are the two-candidate vote. This mostly effects the Primary results, if Clinton won 45% to Sanders’ 40%, she would have won 45 / (45 + 40) = 53% of the two-candidate vote).
White Non-Hispanic residents in the district are slightly over-represented among voters (43% of votes versus 40% of the population), and voted the least Democratic (though still being far from Republican).