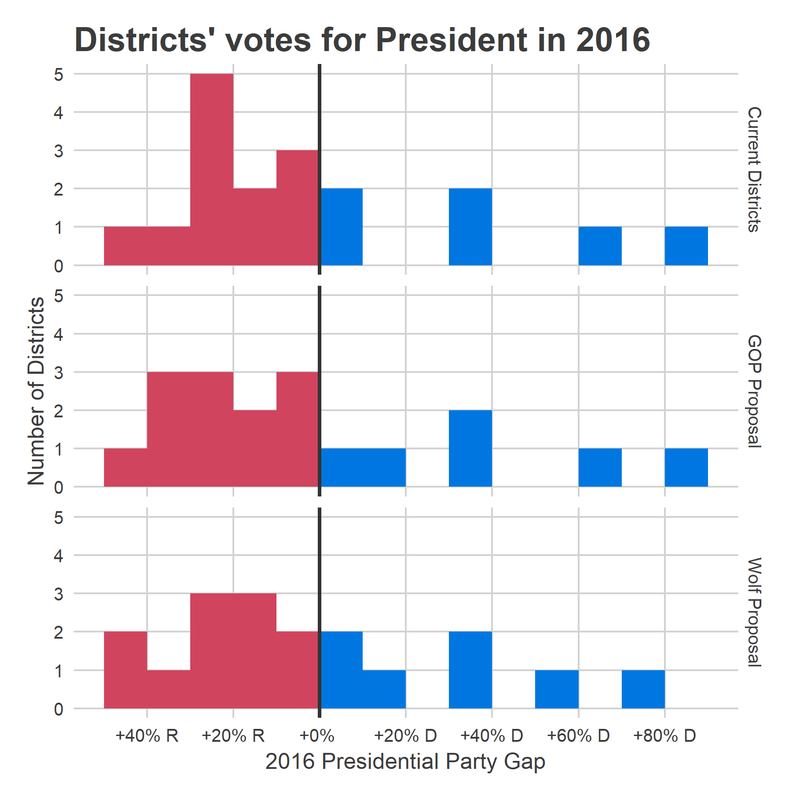
To see how Wolf’s districts would change congressional voting, below is a plot of the current districts’ results in the 2016 Presidential Election, and what it would have been under the proposed districts.
|
|
|
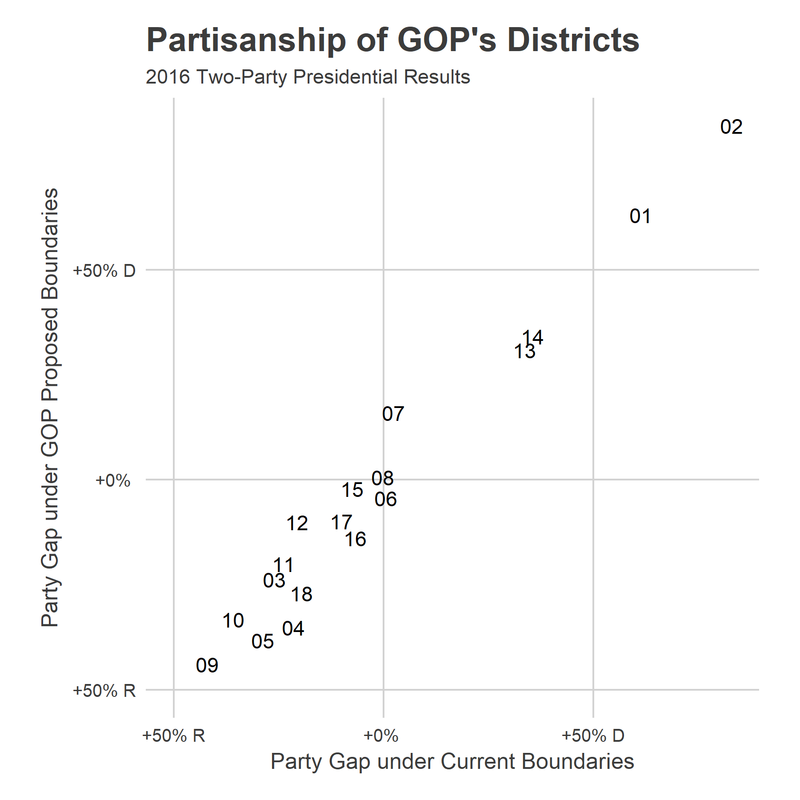
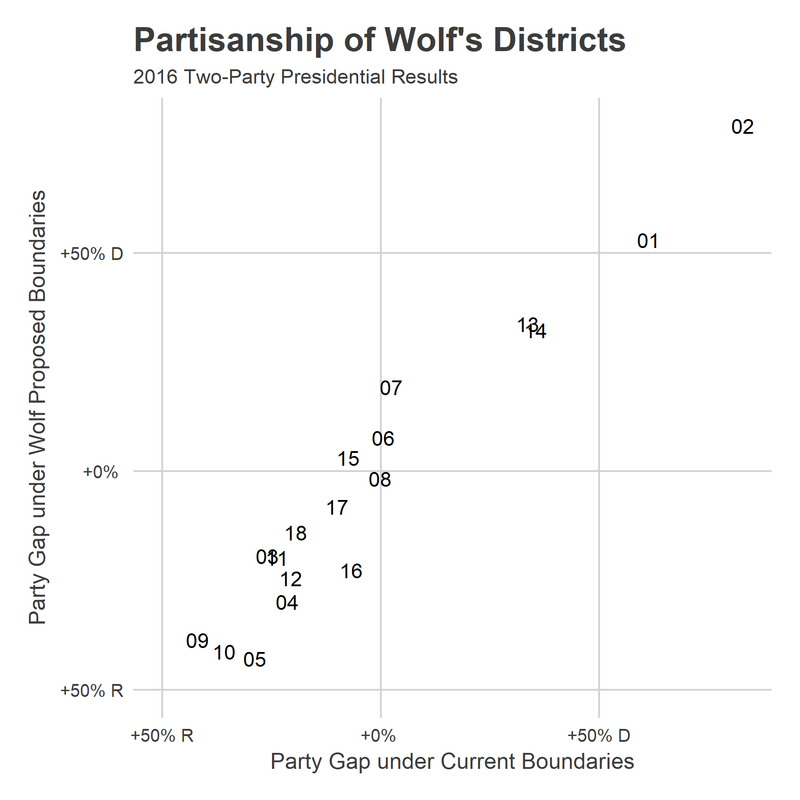
District 6, in Delaware and Chester county voted barely for Clinton in 2016, 48.1% to 47.6%. Under the GOP’s districts, it would have been a Trump 52-48 win (I do all of my projections using only the two-party vote). Under Wolf’s districts, it would have been a Clinton 56-44 win.
Wolf’s plan also changes District 15, which covers Reading and Allentown, from Republican to Democratic. In doing so, it makes Bucks County’s District 8 more Republican; the district narrowly crosses from Blue to Red in the 2016 vote tally.
District 7, Patrick Meehan’s district that the GOP plan sacrifices, similarly becomes a Democratic stronghold under Wolf’s plan. That’s the comically gerrymandered “Goofy kicking Donald” district, and any redistricting that values compactness will almost certainly swing it hard to the left.
Wolf’s map also makes a number of Republican districts much safer. Districts 12 and 16 move from 10-point Republican wins to over 20-point wins, with only District 18 swinging from a 27-point Republican win to a 14-point win.