An open question for the upcoming May Primary is whether Democrats’ newfound energy will translate to the rank-and-file positions of local the local Party. Well, applications have been filed and the Commissioner’s office released the official slate of candidates.. How do the numbers bode for that trickle-down energy?
The hypothetical surge in Committeeperson candidates definitely did not materialize.
In total, there are currently 3,204 candidates on the Democratic ballot, after a number of applications were contested and rejected. That compares to 3,098 that survived to the election in 2014. The counts are from slightly different points in the process. The 2014 data uses election results of non-write-in candidates, while the 2018 uses the recently released Commissioner’s data on candidates who survived potential challenges.
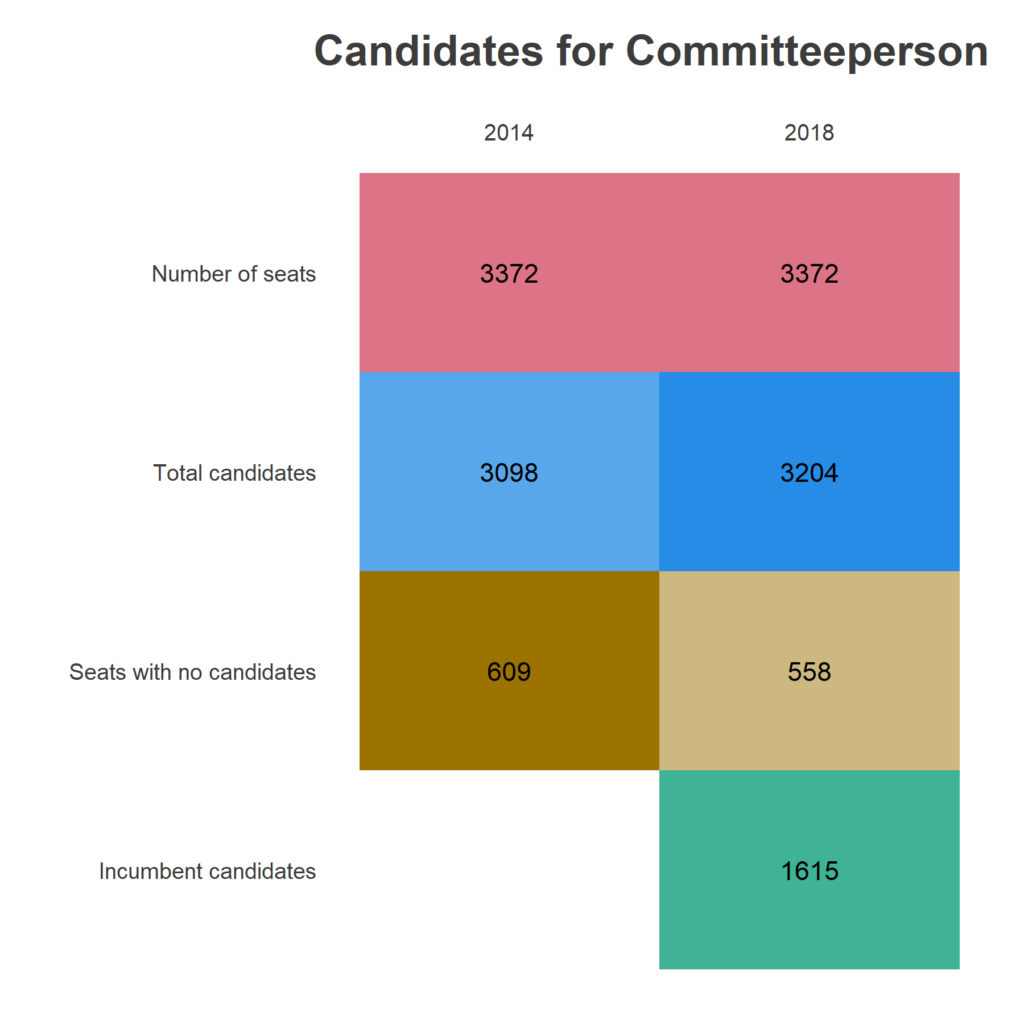
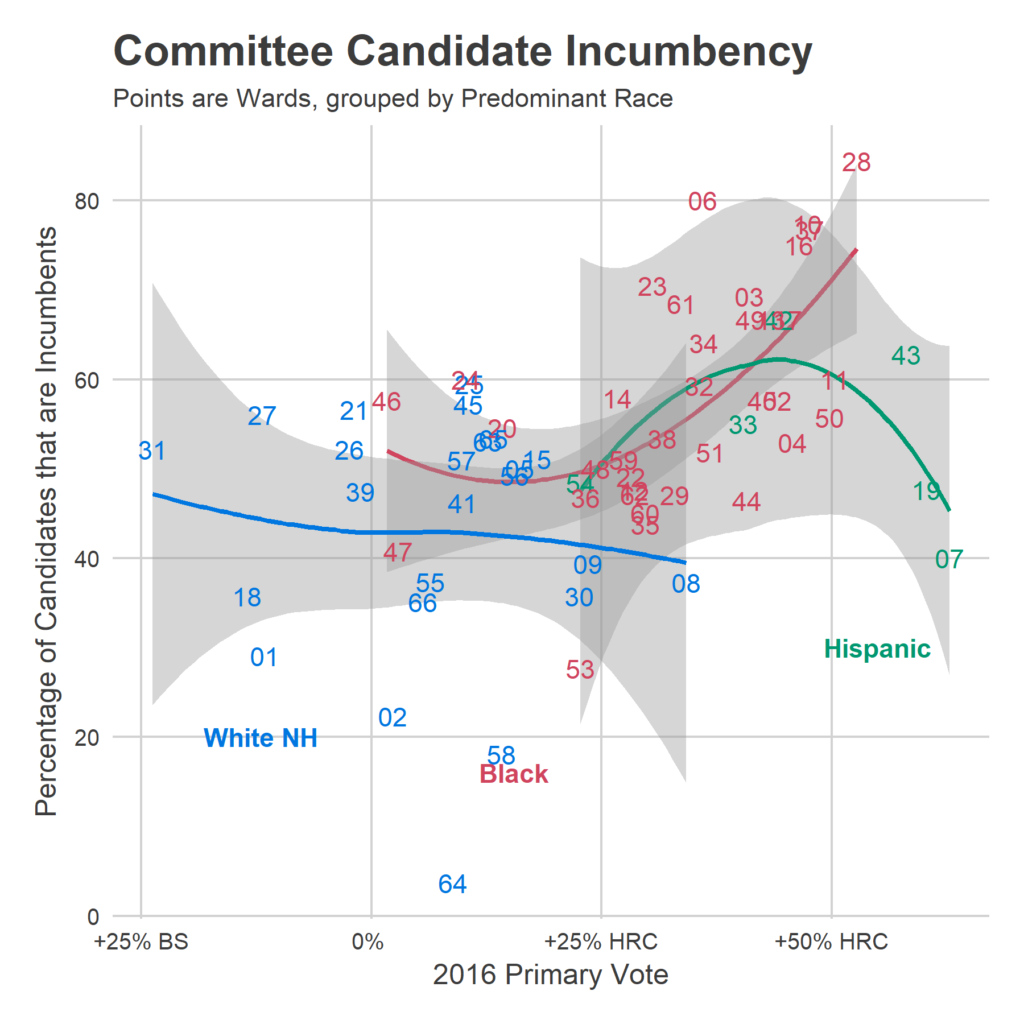
Some 1,615 of those candidates are incumbents. To calculate incumbent candidates, I use fuzzy text matching on candidate names between 2014 and 2018. This tests whether two names are the same based on the fraction of characters that are different. Matching is harder than it may seem because of variability of how candidates write out their names: spellings may change, a candidate may identify as Junior in one but not another, Elizabeth may change her listed name to Betsy. Rather than manually assign incumbency, I automate the process; ‘ve spot checked the fuzzy matching on 40 borderline matches and think I’ve got a good first-order approximation to incumbency assignments.
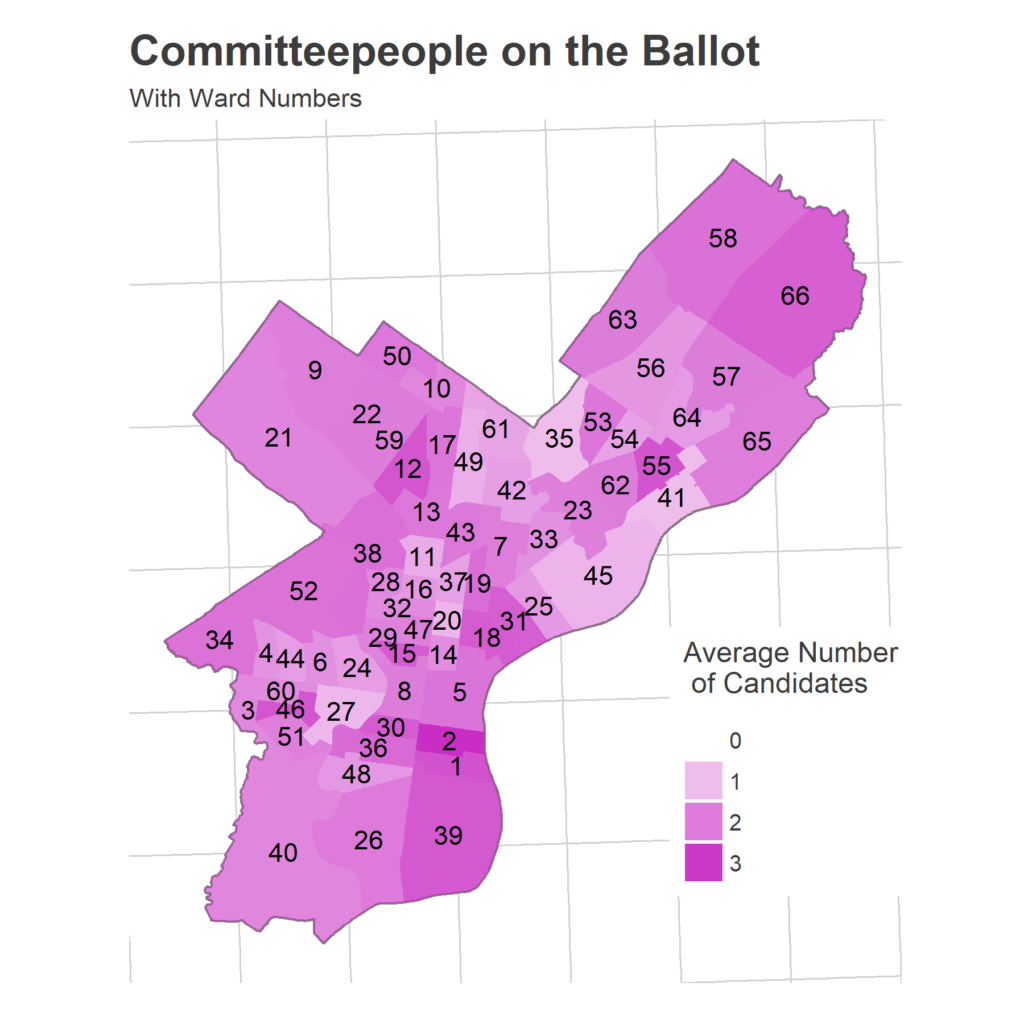
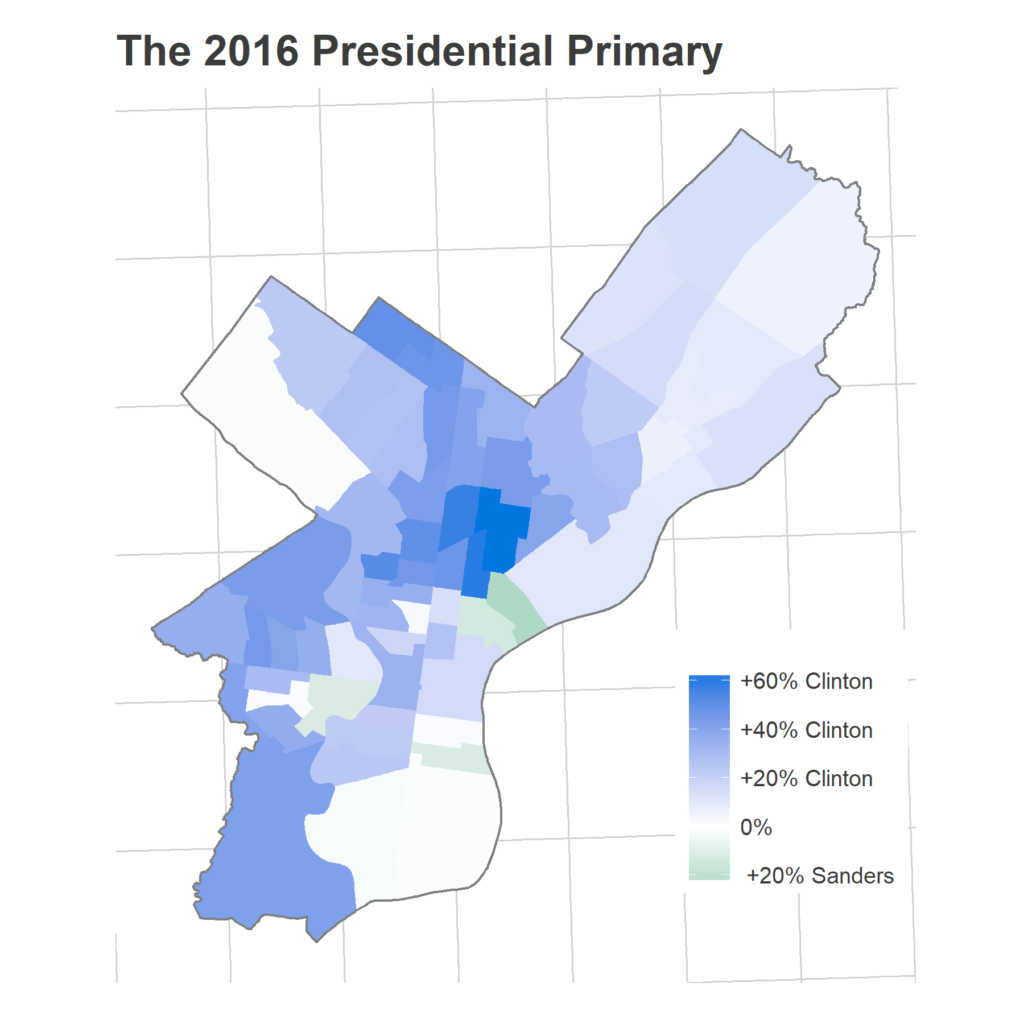
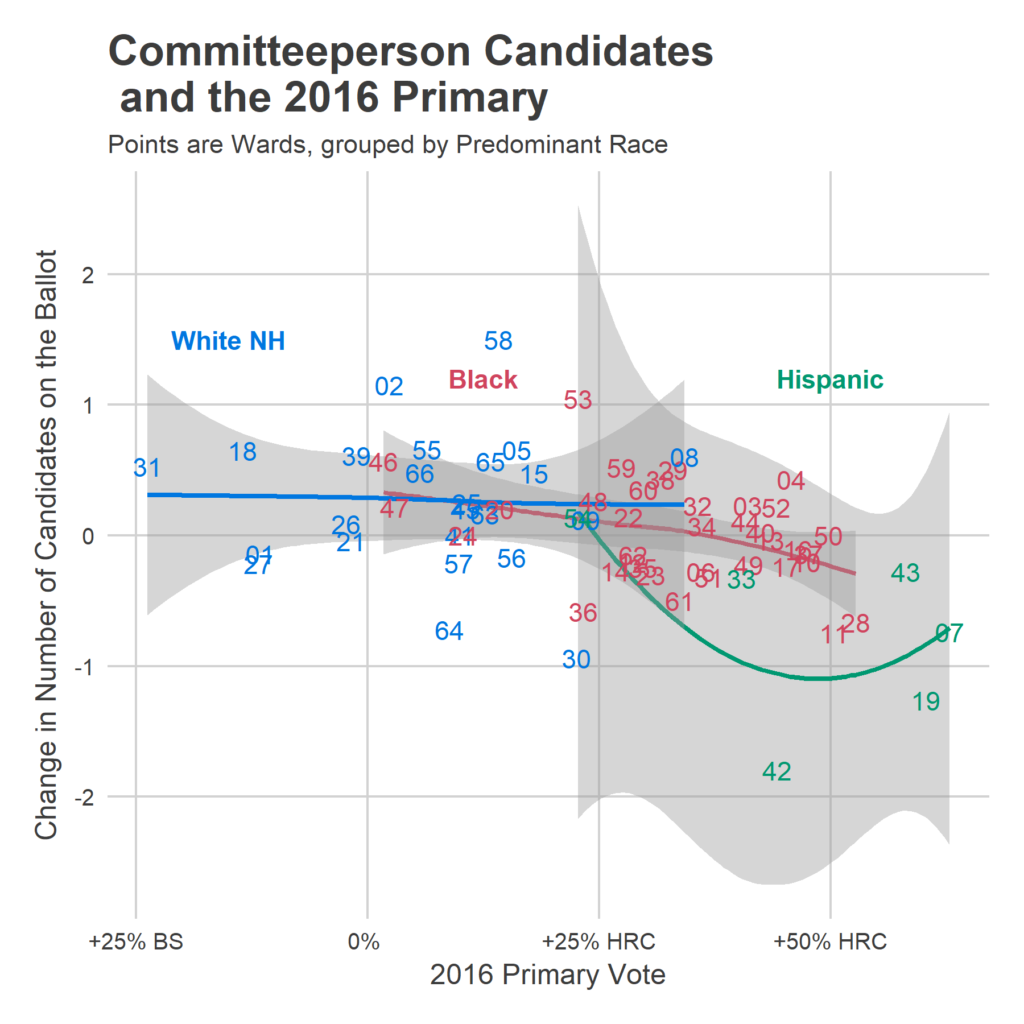
Maybe to see the energy, we need to look in specific places in the city. I often find two useful ways to break up the city: by race, and by vote in the 2016 primary. Race often captures an important axis for identity and experience in the city, while vote in the 2016 primary does two things: differentiates White wards between more establishment (Clinton voters) and less establishment voters (Sanders), and differentiates predominantly Black wards that nonetheless are in the process of gentrifying. Wards 46 and 47 neighbor Penn and Temple, respectively, and are predominantly Black Wards that voted relatively strongly for Sanders, largely because of the sizeable young White population.
There is one dimension that is not captured by the Race x 2016 primary distinction, and that is the Trumpiness of White voters. For example, many White Northeast Wards voted for Sanders, but then also swung towards Trump in the general election. This suggests that their Sanders votes may not have been a declaration of progressivism, but a vote against Clinton. Looking at Sanders-voting White wards will conflate the young progressives in the center of the city with the anti-Clinton voters of the Northeast.
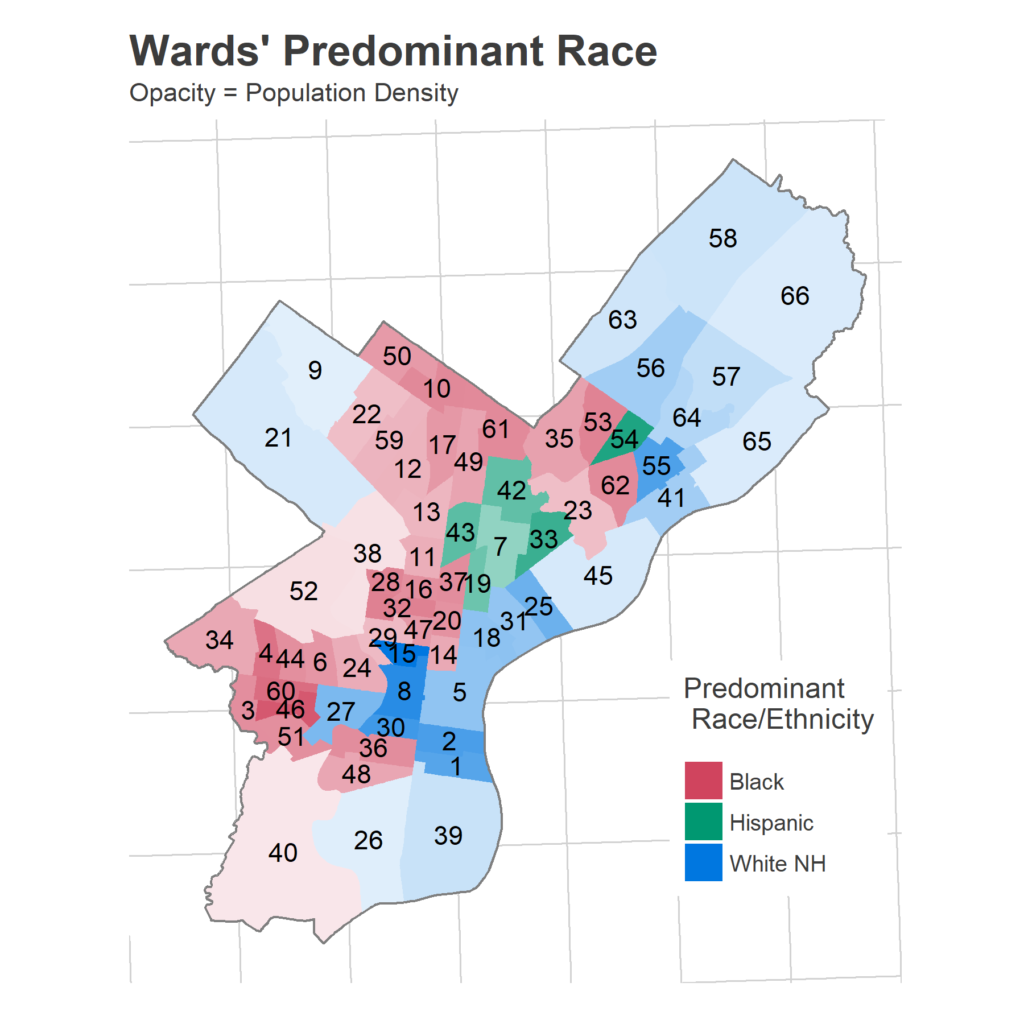
For reference in the upcoming discussion, here is a map of wards’ predominant race and ethnicity, calculated using the 2012-2016 American Community Survey.
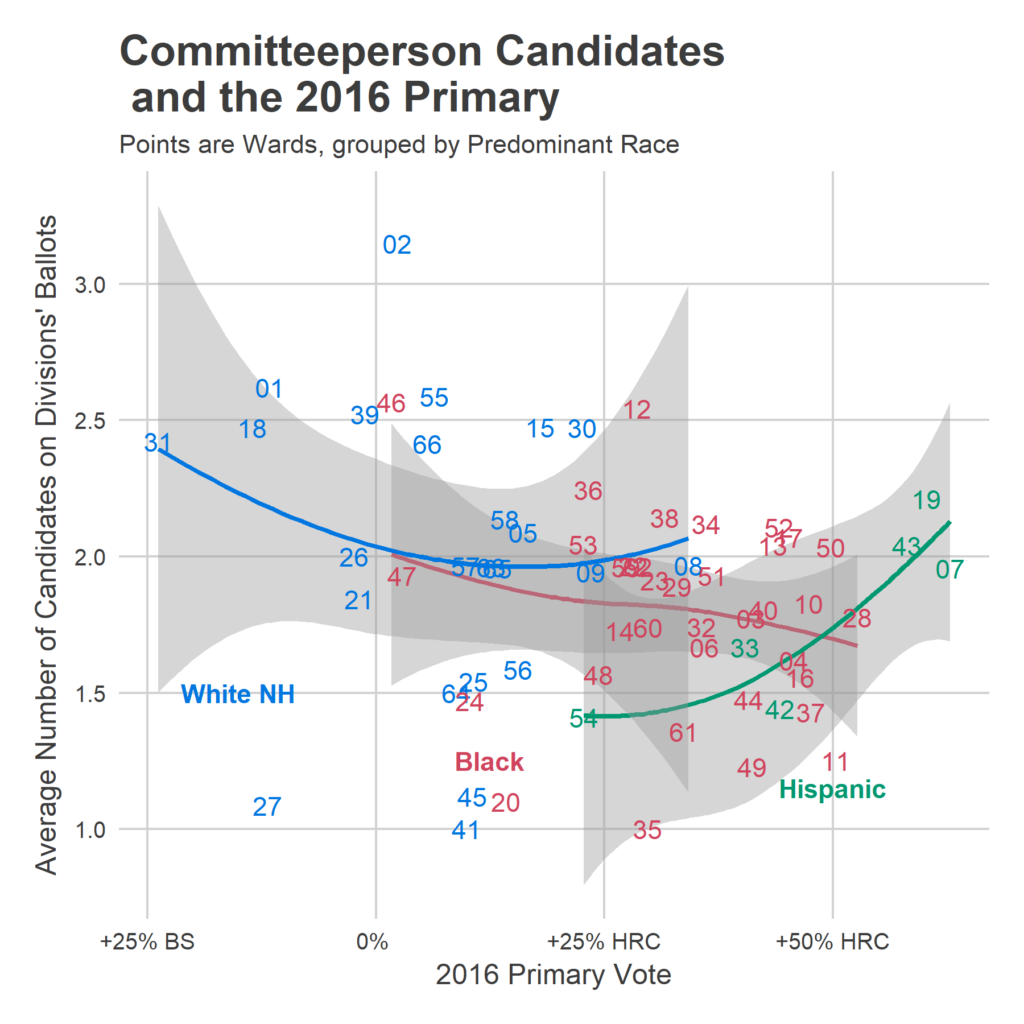
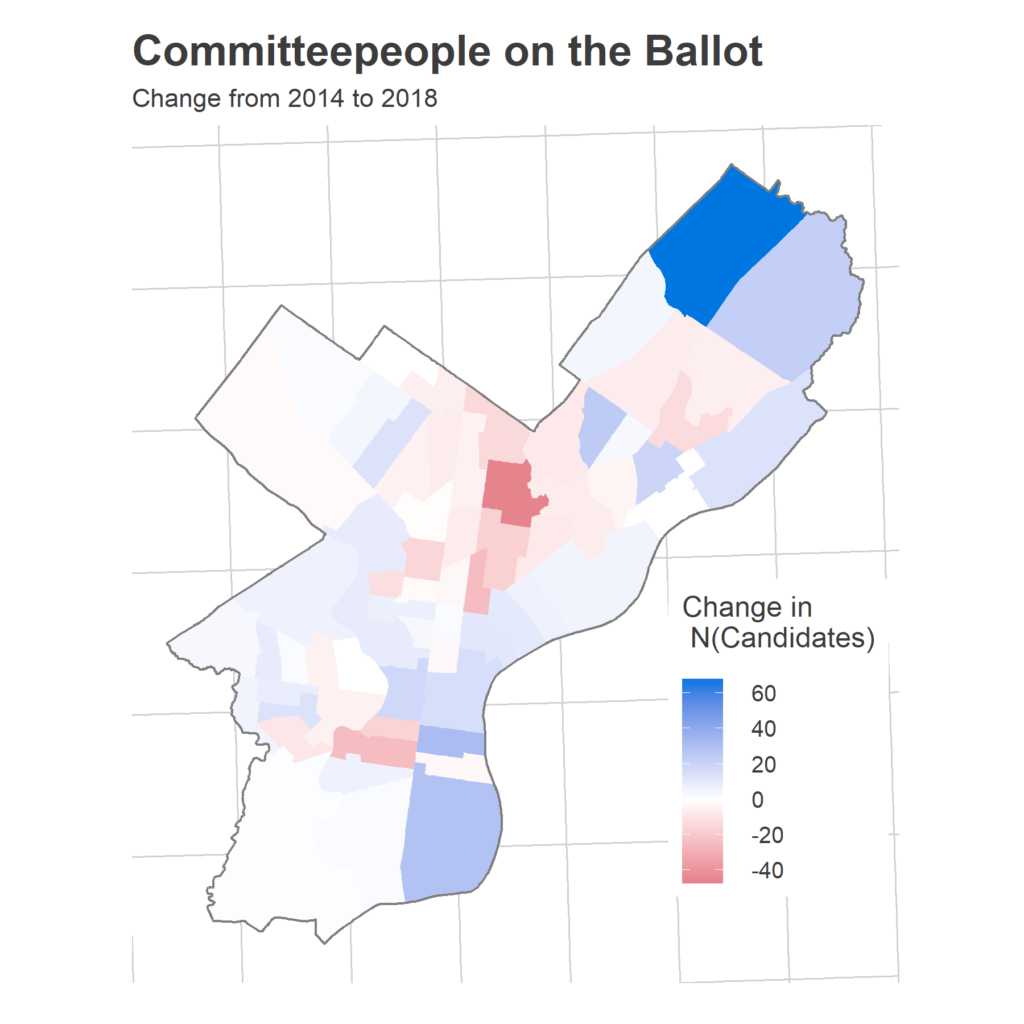
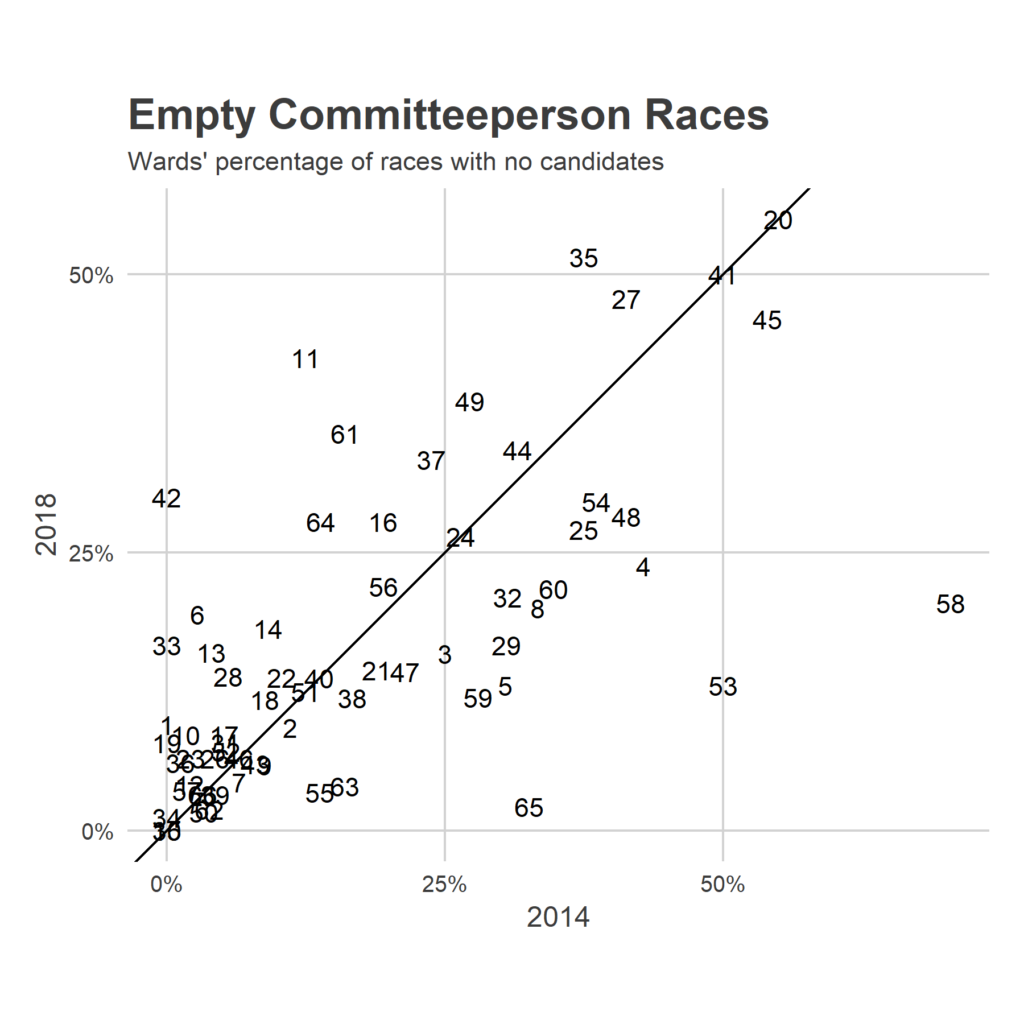
So how about the change in the number of candidates? Did this newfound energy make Bernie-loving wards mobilize committeepeople en masse?
The May 15th primary will see many new Committeepeople be seated, and decide the which Democrats run for all of the important (newly-redistricted) U.S. House and the PA State House and Senate races. The surge in energy that many predicted didn’t seem to materialize in residents running for committeeperson, but the primary will give us a much better sense of who is energized where, ahead of the national November midterms (and race for governor).
I’ve got some exciting news planned for the primary. Stay tuned!